Introduction: In recent efforts to enhance educational strategies at Cobblestone Learning Centers (CLC), a leading provider of tutoring services and test preparation courses for students in grades 7-12, I’ve experimented 3 programs aimed at improving student learning outcomes. These initiatives span 3 centers across our metropolitan area, leveraging both in-person and online modalities to reach a diverse student population.
This post delves into a quasi-experimental analysis conducted to assess the effectiveness of 3 course programs relative to a control group.
Data Collection: At Cobblestone Learning Centers, I conducted a quasi-experimental evaluation of three educational programs (Programs A, B, and C), aimed at enhancing reading and mathematics skills, alongside a control group that received no specific intervention. Initial ‘intake’ assessments were gathered on August 15, 2023, for all students enrolled in our SkillsAdvantage program across 3 districts.
Programs A, B, and C were implemented in designated districts—Program A in Lake Oswego and Ridgefield, Program B in Camas and Sherwood, and Program C in Riverdale and Wilsonville—while the control group’s data was collected from students in St. Paul and Beaverton districts.
Following the interventions from August to October 2023, ‘exit’ scores were assessed to determine each program’s impact compared to the control group.
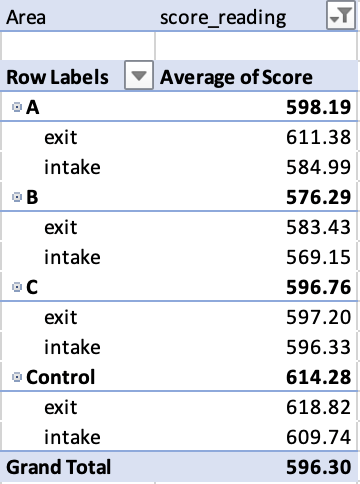
Methodology and Results: Using Excel, I created pivot tables to visually summarize the average scores for Programs A, B, and C from intake to exit, comparing these to a control group. This preliminary step allowed us to organize the data effectively for further analysis.
Below is an example for Reading Performance:
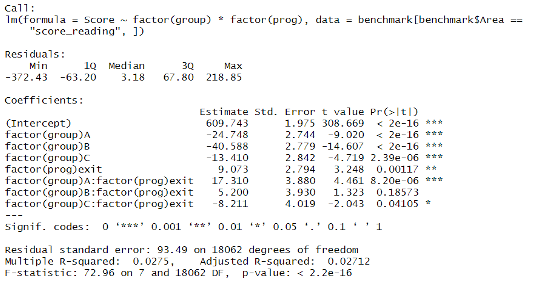
For a deeper quantitative assessment, I conducted a linear regression analysis in R, adjusting for initial score differences and isolating the effects of the educational programs.
The regression output, as shown below, quantifying changes with precise coefficients and assessing statistical significance through p-values and confidence intervals.
Dependent Variable: ‘score_reading’, representing the students’ reading scores.
Independent Variables:
- Groups: Included as categorical variables (Program A, B, C, and Control), allowing us to measure the differential impact of each program against the control.
- Prog: A binary variable indicating whether the score was taken at intake or exit.
- Interaction Terms: Interaction between groups and the binary variable was included to understand if the changes from intake to exit were significantly different in the treatment groups compared to the control.
Regression Analysis: Baseline Performance
The regression model begins with an intercept of 609.743, representing the average score of students in the control group at intake. This figure serves as a crucial baseline, helping us compare the initial performance across all groups. Notably, students in Programs A, B, and C commenced with scores significantly lower than this baseline—24.748, 40.588, and 13.410 points lower, respectively. These figures are instrumental in illustrating the initial academic challenges faced by students in each program, setting a differential starting point that each educational intervention seeks to address.
Program-Specific Achievements
Program A demonstrated a significant improvement in scores, with an average increase of 17.31 points from intake to exit, suggesting a robust impact on student performance.
Program B showed a modest increase of 5.20 points, indicating a positive yet less pronounced effect.
Program C, interestingly, displayed a decrease in scores by 8.21 points, raising concerns about its efficacy.
The coefficient for ‘factor(prog)exit’, calculated at 9.073 points, indicates an average improvement across all students by the end of the programs, reflecting general educational growth. However, the interaction terms, particularly significant for Program A (17.310 points), tell a more compelling story. This value demonstrates that Program A not only helped students overcome their initial disadvantage but also propelled them to achieve gains above the natural progression seen in the control group. This marks a notable success in our targeted educational strategies, especially given the initial lower starting points.
Contextualizing Course Effect
These results highlight the tailored approaches required to meet diverse educational needs. For instance, the larger initial deficit in Program B underscores the necessity for more intensive or specialized instructional strategies. Conversely, the modest gap for Program C suggests a need for different forms of support compared to those provided in Programs A and B.
This regression analysis is crucial for understanding which interventions are most effective and why. Particularly, the interaction effects reveal how specific programs influence student performance over time, distinguishing between mere natural progression and the actual impact of the courses.
Conclusion: The results underscore the varied impacts of educational interventions. Program A’s success may encourage further investment and refinement, whereas Program C’s outcomes prompt a reevaluation. The study’s quasi-experimental nature requires cautious interpretation of the data, highlighting the potential for confounding variables to influence outcomes. Continued research, ideally incorporating randomized trials, will be essential to build on these findings and refine our understanding of educational impacts.

Leave a comment