Introduction
In today’s competitive market landscape, understanding and retaining customers is paramount for businesses, especially those operating on a small scale with limited marketing budgets. My recent project, detailed below, employs RFM (Recency, Frequency, Monetary) analysis to delve into customer behavior, aiming to enhance marketing strategies and boost customer retention.


What is RFM Analysis?
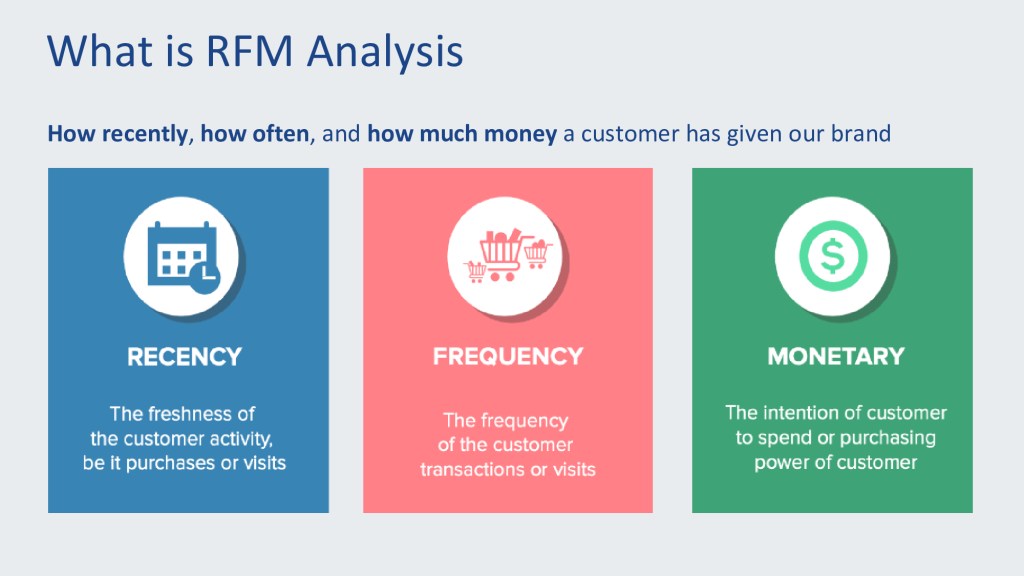
RFM Analysis is a proven marketing model that segments customers based on their transaction history. It focuses on three key aspects:
- Recency: How recently a customer made a purchase
- Frequency: How often they purchase
- Monetary Value: How much money they spend
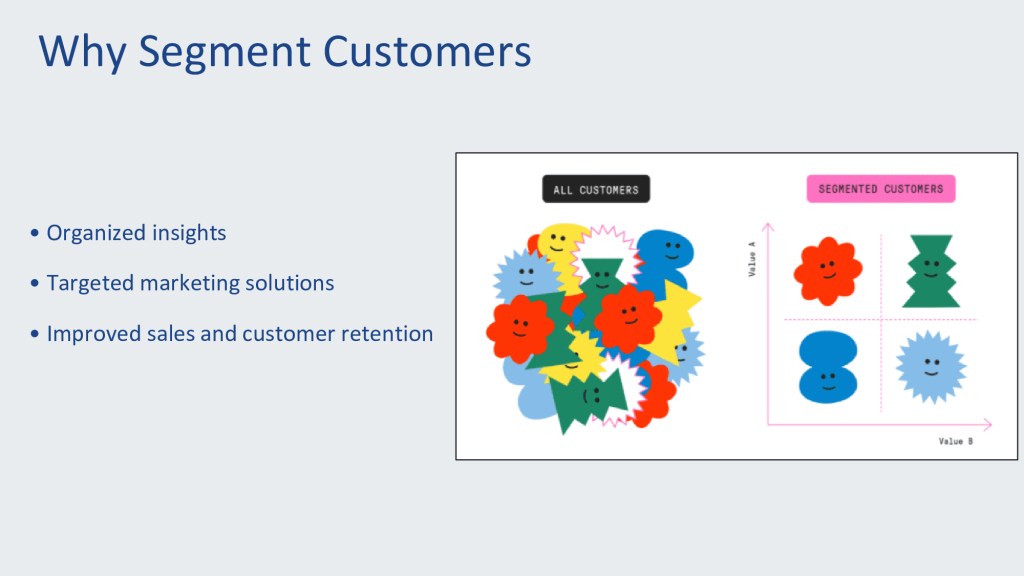
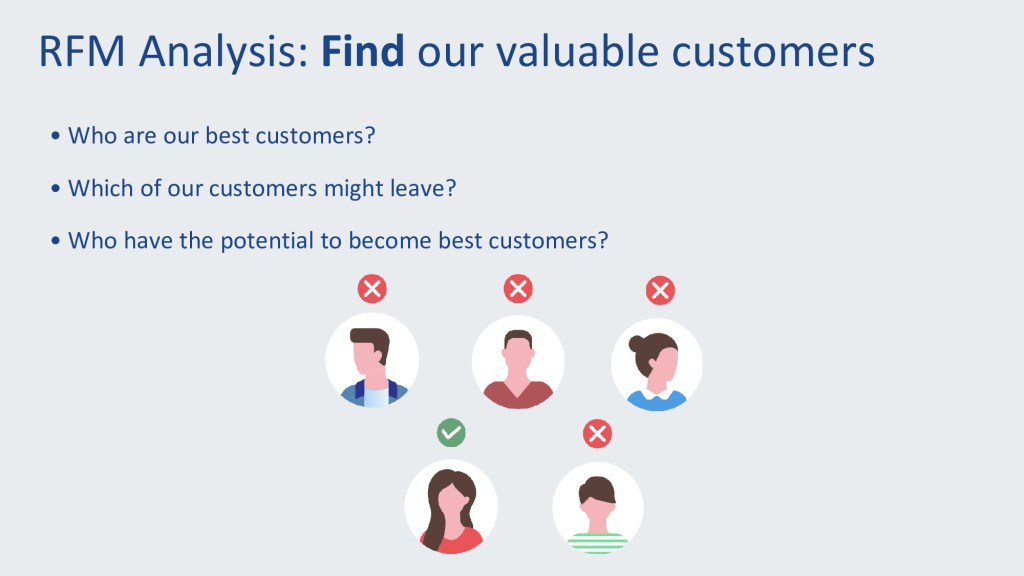
These metrics help identify the most valuable customers, those at risk of churn, and those who could potentially become top spenders.
Project Overview
For this project, I analyzed data from a company that operates within a niche market. The data included variables like customer ID, product descriptions, unit prices, quantities bought, total money spent, transaction dates, and order IDs.
Methodology
Using R, a powerful tool for data analysis, I performed the following steps:
- Data Cleaning: I prepared the dataset by filtering out invalid entries and transforming data types for accurate analysis.
- RFM Score Calculation: Each customer was assigned scores based on recency, frequency, and monetary value.
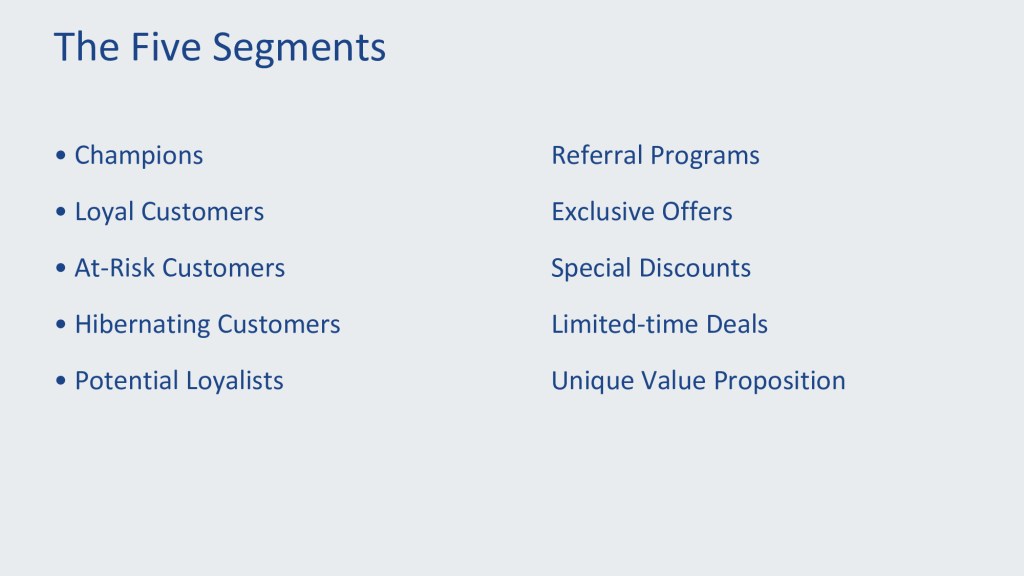
- Customer Segmentation: I segmented customers into meaningful groups such as Champions, Loyal Customers, Potential Loyalists, New Customers, and others.
# Sample code snippet for RFM scoring
rfm_scores <- online_retail %>%
  group_by(CustomerID) %>%
  summarise(
    Recency = as.numeric(reference_date - max(as.Date(InvoiceDate))),
    Frequency = n_distinct(Invoice),
    Monetary = sum(Money)
  ) %>%
  mutate(
    RecencyScore = ntile(-Recency, 5),
    FrequencyScore = ntile(Frequency, 5),
    MonetaryScore = ntile(Monetary, 5)
  )
Results and Visualizations
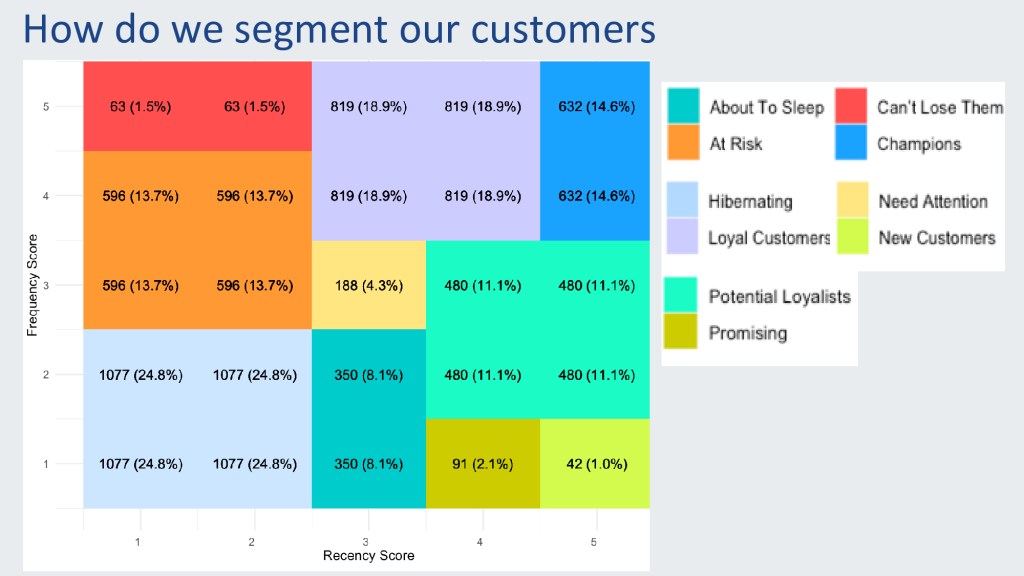
The analysis provided deep insights into customer behavior. Key visualizations included:
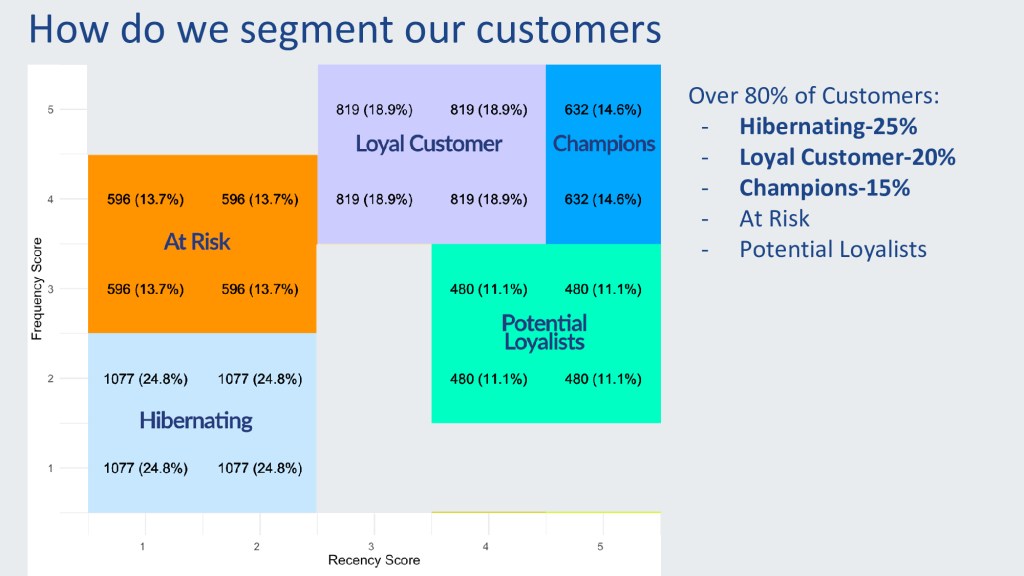
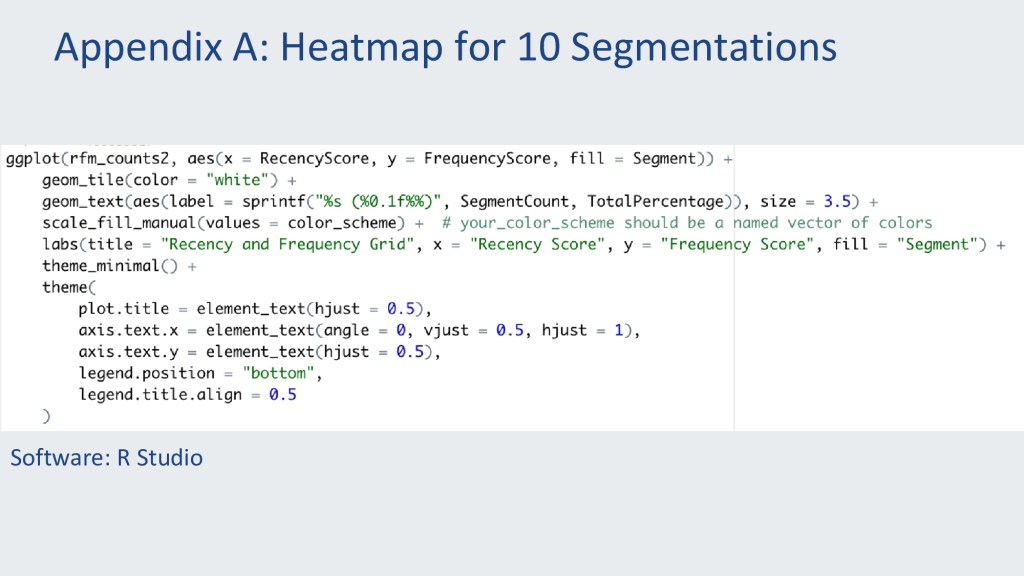
- RFM Heatmap: This visualization helped in quickly identifying customer segments based on their RFM scores.
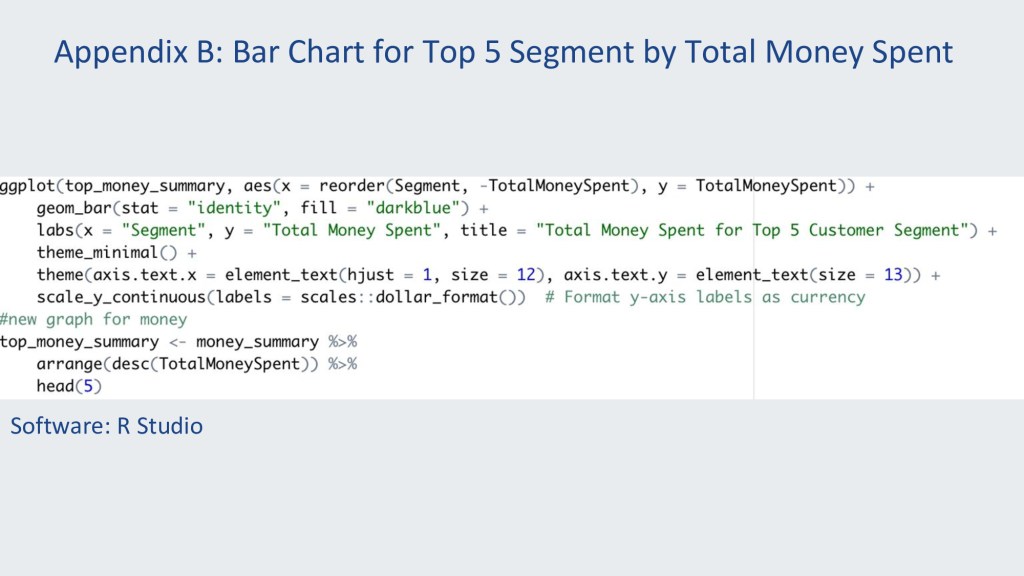
- Bar Chart for Top 5 Segments by Total Money Spent: This chart highlighted segments that contribute most to the revenue.
Here’s a glimpse of the RFM heatmap created using ggplot2 in R:
# RFM heatmap plot code snippet
ggplot(rfm_summary, aes(x = RecencyScore, y = FrequencyScore, fill = Segment)) +
    geom_tile(color = "white", size = 0.1) +
    geom_text(aes(label = paste0(Count, "\n(", Percentage, "%)")), size = 3) +
    scale_fill_manual(values = color_scheme) +
    labs(x = "Recency Score", y = "Frequency Score", fill = "Segment") +
    theme_minimal()
Conclusion
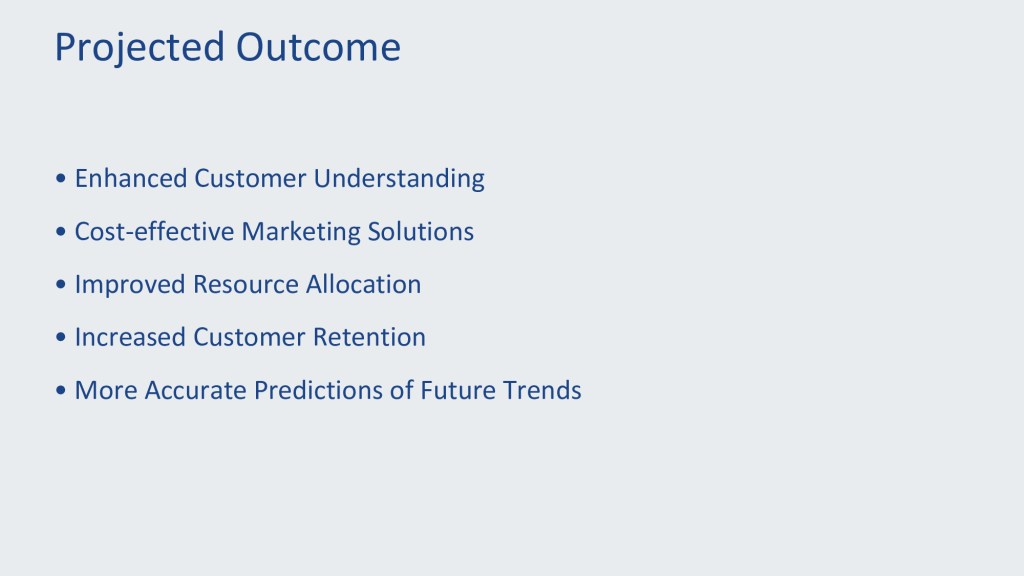
The RFM analysis not only helped in understanding the current customer base but also paved the way for targeted marketing strategies that are cost-effective and tailored to different customer needs. Moving forward, the insights derived from this study will aid in more accurate predictions of future trends and improved resource allocation.
For those interested in the technical aspects or looking to replicate this analysis, I have shared the complete R scripts in the link down below.
